By Stephen Chun
Have you ever been on a Muni vehicle and realized that if the light had only stayed green for just a few more seconds you wouldn’t have been trapped at a red light? SFMTA’s Connected Corridor Pilot approached this problem with a new state of the art solution.
Most signals in San Francisco do not have sensors to detect vehicles at an intersection. However, through a grant from the U.S. Department of Transportation, our project team was able to test an advanced technology for signal timing based on who is present at an intersection. In this way, transit platform and traffic signal sensor data can be used to activate signal timing adjustments, responding to traffic conditions in real time. These adjustments provide more opportunities for transit vehicles to make it through intersections on a green light.
The project team turned on the adaptive signal timing program during several days in July and August 2021, with traffic engineers and traffic signal electricians monitoring intersections both in-person and by observing traffic cameras. Our priority was to reduce transit vehicle travel times. Once in place, we compared travel times for trains both before and after the new technology was implemented.
We found that with our pilot project, the average light rail vehicle (LRV) travel time along the 1-mile corridor was reduced by 66 seconds, resulting in an average travel speed increase of 21% from 8.2 miles per hour (MPH) to 9.9 MPH. With this system, the chance that a train will reach an intersection on a green light improved from 62.1% to 85.8%, meaning almost no red-light delay.
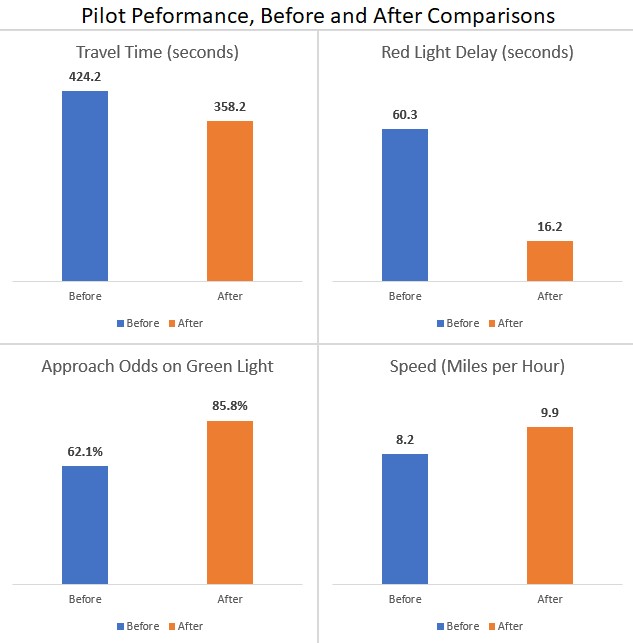
Figure 1. Pilot Corridor Performance, Before and After Comparisons
During the pilot, 60% of LRV corridor trips had 10 seconds or less of red-light delay, compared to only 5% previously. In fact, 20% of trains saw no red-light delay at all on the corridor, compared to the previous study period when not a single train avoided red light delay entirely.
Improving signal timing for just one specific mode or direction can potentially result in negative impacts for others. To evaluate this, we measured travel impacts to pedestrians and non-Muni vehicles to evaluate the potential effects from prioritizing transit. Fortunately, our data show that there was a 1% increase in the overall odds that other vehicles would encounter a green light and only a 1% increase in the odds that pedestrians would reach an intersection on a Do Not Walk symbol.
Vehicles on side streets were generally unaffected unless they were also held to prioritize train through traffic. Heavier volume side streets such as Mariposa Street had increased average wait times of up to 78% for vehicles, from an average wait of 46 seconds previously, to an average wait of 87 seconds during the pilot. Fortunately, the adaptive signal system only increased the average wait time by 4 seconds for pedestrians if they arrived on a Do Not Walk symbol, from 22 seconds to 26 seconds. Further refinement of the signal timing logic could help address these concerns.
With detailed information collected through the advanced sensors, our project team was able to make refinements and real-time signal timing adjustments that account for time of day, direction of travel, and the real-time volume of pedestrians, vehicles, and transit vehicles.
These promising results will lead the SFMTA to consider applying this technology in other locations to better understand how the system could work more widely around the city and any trade-offs that could arise in regard to overall traffic flows.
Looking forward, we are also exploring other new technologies. For example, the LiDAR (sensors that use lasers to identify objects) used in this project provides a new way to capture and classify objects at intersections, but there may be a need for additional sensors or different mounting locations to improve detection accuracy. Project staff will build upon the lessons learned from the pilot to inform future efforts to optimize the signal timing to make our streets better for all users.
Published November 30, 2021 at 01:01PM
https://ift.tt/31fWtr4
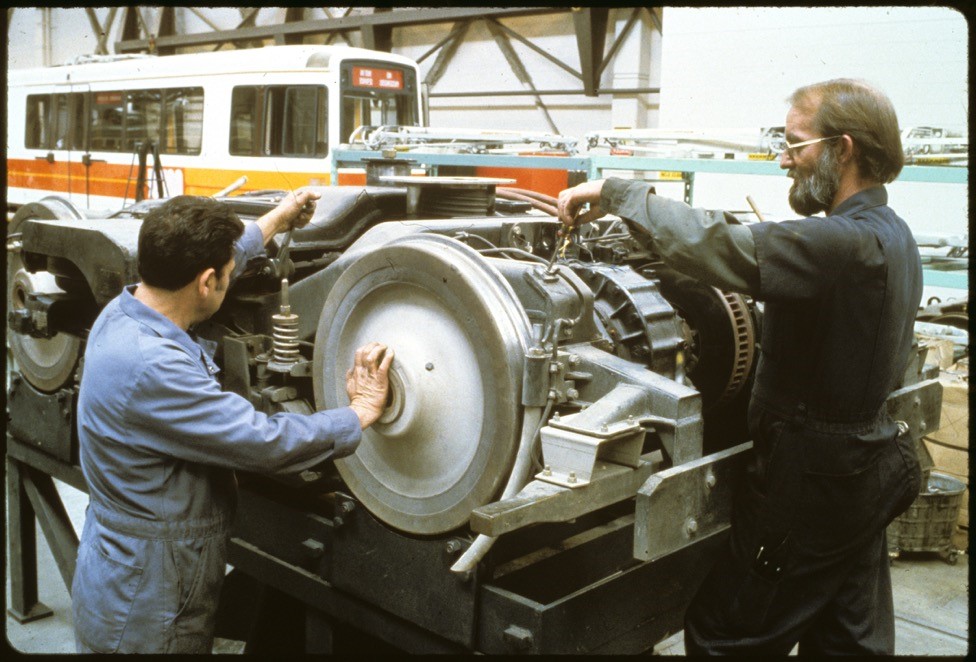
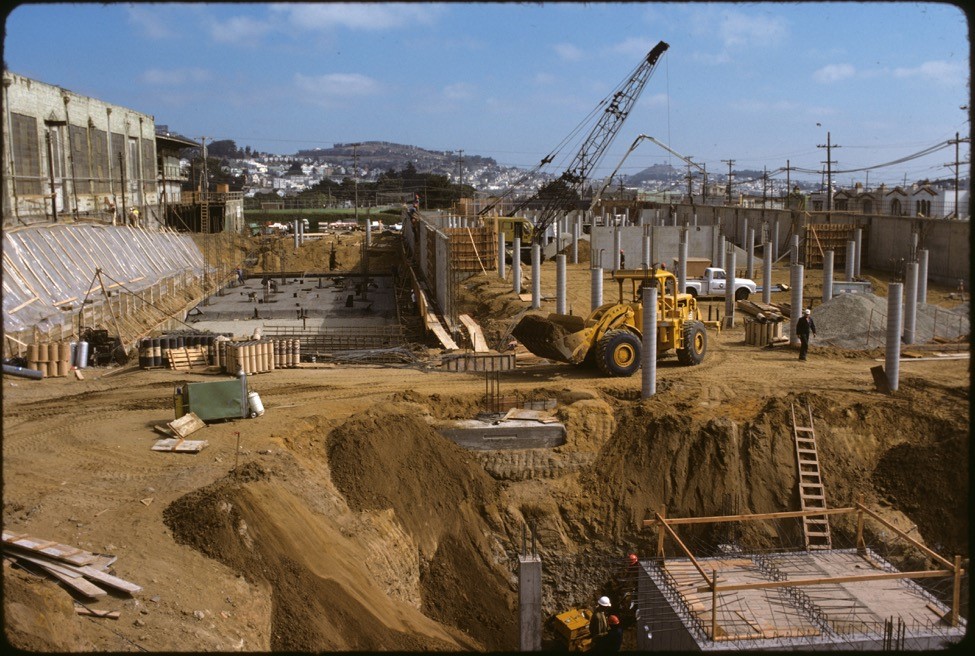 This 1976 photo shows major excavation and concrete work underway for the main shops building of Green Division. At far left is Elkton Shops built in 1907 by the United Railroads Company.
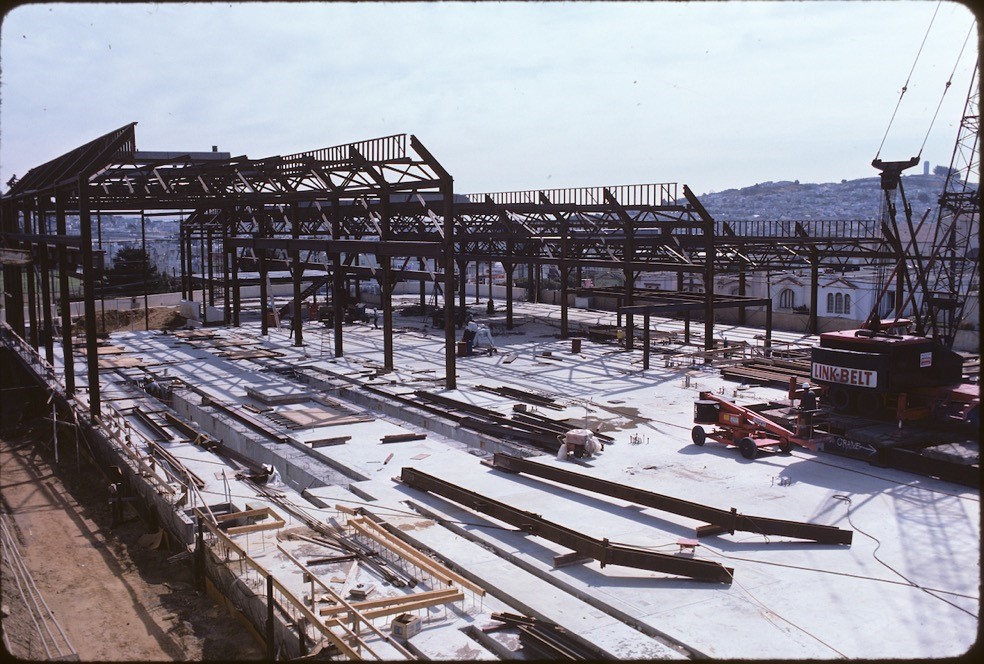

 Heads up! Installation of overhead line equipment at 4th and King streets starts Nov. 17. Consider taking an alternative route if driving through the area as work for the Central Subway will require detouring traffic. N Judah and T Third rail service will be served by buses starting at approximately 9 p.m. each night that work is performed.
 In early October, a San Francisco jury found that the SFMTA did not breach its taxi medallion program Lender Agreements with the San Francisco Federal Credit Union. Throughout this litigation, the SFMTA has continued to focus its attention on supporting purchased medallion holders and drivers. In fact, over a year ago, the SFMTA made an offer to settle the lawsuit by providing millions of dollars in loan forgiveness to medallion holders. Unfortunately, the SF Credit Union opted to continue its lawsuit against us. With the trial now behind us, we are hopeful that the Credit Union will engage in the necessary dialogue with us and agree to participate in a loan forgiveness program.